User Manual
This manual describes how to access data and use the tools on the Pulse Crop Database. Please see the links below and to the left to navigate to different parts of the manual.
Homepage Overview
The PCD homepage is divided into a few key areas to help facilitate navigation. The Crops Quick Start (Fig. 1A), has icons for each crop represented in PCD. Clicking on the crop icon takes you to the Crop Overview page (see Crop Overview Page) which allows for quick access to all the data associated with that crop. To the right of the Crop Quick Start is the Tools Quick Start (Fig. 1B). This area has links to common tools and data search interfaces. The center region of the homepage contains a News and Events section (Fig. 1C) which has news about PCD as well as from the community. The homepage also has the traditional pull-down menu bar in the header (Fig. 1D) which also provide access to the crop overview pages, data, search pages, tools, and general information.
.jpg)
Figure 1. PCD Homepage
The items under the Search and Tools menus are discussed in other tutorials, but we want to highlight the Data and General menus in this section of the tutorial. Under the Data menu (Fig 2A), you can see a data overview, learn how to submit data, download data, view publication datasets and view information on PCD trait and marker type abbreviations. A summary overview of all data on PCD, which can be broken down by crop and/or data type, is found on the Overview page. Under Data Submission, there are details about submitting data to PCD. PCD will accept published data and we highly recommend contacting us before starting to fill in the data templates. There are two links to the contact form on this page.
The Data Download page contains links to all the various data types in PCD. The links redirect you to either a search page, analysis page, or a table where the information about the data and links to download files are located. For the RefTrans, Unigene, and genome data, the links take you to the analysis page with details about the data and these pages have a link on the left for the download page. For germplasm, markers, QTLs, transcripts and sequences, the links take you to the search page for that data. On the search page, choose your parameters and click submit to retrieve data. The resulting table can then be downloaded. The Publication Datasets page contains supplementary data for publications. These authors chose to make the supplementary information available on PCD and the files were posted prior to submission so the reviewers could access the data.
The Trait Abbreviations page contains the QTL traits that are in PCD and the abbreviations that are used for the internal PCD database generated QTL ID. We have tried to keep our abbreviations consistent with those used in the trait and crop ontologies. On the Marker Types page, there is a table of the marker types that are in PCD. The markers have been generally grouped by the same technologies and we have provided a link to a reference that describes the marker technology. The Field Book link takes you to information about the Android App that is used for data collection and upload to PCD.
.jpg)
Figure 2. Data and General menu items.
The General menu (Fig. 2B) contains links to a variety of different items. If you would like to subscribe to the PCD mailing list, please click on Mailing Lists and complete the web form. The General menu also has links to past presentations about PCD, work that is in progress and completed, and how to reference PCD. The Help menu (Fig. 2C) has a link to the PCD User Manual and video tutorials. There is also a Contact link that opens a fillable web form. We appreciate input on the website as well as reports of website bugs and data errors.
Crop Overview Page
All the available data for each crop is easily found through the Crop Overview Page. From the PCD homepage, the crop overview pages are accessed either by clicking on the Crops menu in the toolbar and selecting the crop of interest (Fig. 3A) or clicking on the crop under the Crops Quick Start section (Fig. 3B).
.jpg)
Figure 3. Accessing the Crop Overview Pages from the homepage.
On the Crop Overview Page, there are two main sections. The left side toolbar is static and has a Data section and a Tools section (Fig. 4A). Clicking on the links in these sections either changes the information to the right of the toolbar (Fig. 4B), or opens another tab with the linked information. The Crop Overview Page defaults to the Overview section for each crop which contains basic information and a summary of the available data in PCD.
.jpg)
Figure 4. PCD Crop Overview Page
Many of the left toolbar links will dynamically change the content to the right of the toolbar (Fig. 5). For example, when the Germplasm link is clicked, a list of germplasm in PCD is displayed. Green text indicates a hyperlink that will display more detailed information. For Transcripts, a table with summary information for the RefTrans and Unigene assemblies is displayed along with links to more detailed information.
.jpg)
Figure 5. Dynamic data
The the left toolbar links open new tabs. As an example, the Genetic Maps link opens a new tab that has a table of all the genetic maps for the crop (Fig. 6). Green text on the table indicates links to detailed information. The Markers, Publications, Sequences, and Trait Loci links open search interfaces for the selected data type. Please see the separate tutorials for more information on how to use the different data searches and tools.
.jpg)
Figure 6. Genetic Map page and example of detailed information available under hyperlink indicated by green text
Data Searches
To access the different data searches, click on the Search menu in the header and then select the data type you would like to search (Fig. 7). To learn more about each search interface, please see the links below the figure.
.jpg)
Figure 7. Search menu in header provides links to different searches.
Genes and Transcripts
The Genes and Transcripts Search is located under the Search menu in the header. The Genes and Transcripts Search allows you to search sequences that are available in PCD with several different parameters. A few parameters can be used to return a broad range of results, or numerous parameters can be used to find very specific data. Searches can be limited to a certain genus and species. Once a genus has been selected, the species list will be populated and then a species selection can be made (Fig. 8A). Searches can also be limited to datasets, such as genome and RefTrans assemblies or NCBI genes. For a genome assembly dataset, the search can be restricted to a chromosome or scaffold and further restricted to a region on that chromosome or scaffold (Fig. 8B). Searches for a specific gene or transcript name, or a list of names that are uploaded as a text file, are also possible with this search interface.
.jpg)
Figure 8. PCD Genes and Transcript Search interface.
Right about the the "Search" button is an option to customize the output (Fig. 9A). Users can choose which columns are displayed before retrieving the search results. All search results are returned as a table with hyperlinks to more info (Fig. 9). The table can be downloaded and a Fasta file of the returned sequences can also be downloaded (Fig. 9B). To do another search, click reset.
.jpg)
Figure 9. Gene and Transcript Search results table.
Germplasm
The Germplasm Search can be accessed through the Search menu in the header. Information about germplasm linked to data in PCD can be searched by species (Fig. 10A) and/or name (Fig. 10B). A list of germplasm names, in a text file, can also be uploaded to search for multiple germplasm at once.
.jpg)
Figure 10. PCD Germplasm Search interface.
Results are returned in a table format that can be downloaded (Fig. 11A). Green text indicates hyperlinks to more detailed information (Fig. 11B). Searches can be refined by editing the parameters or a new search can be initiated by clicking the reset button.
.jpg)
Figure 11. PCD Germplasm Search results.
Markers
To search the markers in PCD, click on the Search menu in the header and select Marker Search. The Marker Search is useful for retreiving information about markers and can be a broad search or a very specific search depending on the number of parameters used. Markers can be searched by typing in a marker name, or a text file of multiple marker names can be uploaded to search for multiple markers at once (Fig. 12). The search can also be restricted by the marker type (Fig. 12A), the species the marker was developed in, or the species the marker was mapped in. To find out more information about the marker types, click the question mark logo next to Marker Type. For markers that have been mapped to a genetic map, the search can be restricted to a certain linkage group (Fig. 12B). And the search can be even further restricted to a certain locations on the linkage group.
.jpg)
Figure 12. PCD Marker Search interface
The search results are returned in a table format (Fig. 13). There are hyperlinks within the table that take you to more details about the marker or where the marker is mapped. This data table can be downloaded in a format that can be easily opened in applications such as Excel (Fig. 13A). Clicking on the marker name (Fig. 13B), displays the marker page which has information such as alignments and map positions. If you would like to change the search, either edit the parameters or click the reset button to start all over.
.jpg)
Figure 13. Marker Search results
Publications
To search publications on PCD, click on the Search menu and select Publication Search. The Publication Search is like many common literature searches, but is limited to publications that have been added to PCD. The publications can be searched by using keywords within different fields (Fig. 14A). Multiple fields and keywords can be entered and more fields can be added by clicking the Add/Remove buttons (Fig. 14B). A range of years can also be entered (Fig. 14C).
.jpg)
Figure 14. PCD Publication Search interface
The search results table has information about each publication (Fig. 11A). By clicking the publication title, more detailed information is displayed. Most publications also have a link to the publisher website or PubMed record in their titles (Fig. 11B).
.jpg)
Figure 15. Publication search results and detailed publication information
QTLs and MTLs
Quantitative trait loci (QTLs) and Mendelian trait loci (MTLs) that are entered in PCD are searchable from the QTL Search option under the Search menu in the header. The search can be restricted by QTL or MTL as well as by species (Fig. 16A). A certain trait ontology category can be selected to limit the returned results to only that trait type. If you are looking for a specific trait, you can do a keyword search of the trait names or search by the published name or the PCD assigned name (Fig. 16B). Please see the PCD Trait Abbreviation Table hyperlinked in the directions for the search for more information about the trait abbreviations used in PCD.
.jpg)
Figure 16. PCD QTL Search interface
The results are returned in a table that has green hyperlinks to more information about the QTL or MTL, the map it is located on, and the species it is from (Fig. 17). The table can also be downloaded (Fig. 17A). Clicking on the QTL label, opens the QTL information page which has a link to map positions (Fig. 17B). From the map position table, the QTL can be viewed in MapViewer.
.jpg)
Figure 17. PCD QTL Search results
Sequences
To search sequences, click on the Search menu on the homepage header and select Sequence Search. This search is useful for retrieving information about certain sequences from a larger dataset, or all the sequences from one or more datasets. The Gene and Transcript Search page is for searching genes and transcripts only, whereas the Sequence Search page also includes other sequence types. A few search parameters can be used to return a broad range of results, or more parameters can be selected to find very specific data. This is not a BLAST search, BLAST is available under the Tools menu.
.jpg)
Figure 18. PCD Sequence Search interface
Sequence searches can be limited by genus and species, or sequence type (Fig. 18A). The search can also be restricted to a certain genome dataset and further restricted to a certain chromosome or scaffold location for within that assembly (Fig. 18B). The sequences in PCD can also be searched by sequence name, and there is an option to upload a text file of sequence names (Fig. 18C).
.jpg)
Figure 19. Search results table
All search results are returned in a table with hyperlinks to more information (Fig. 19A). The results table can be downloaded and a Fasta file of the sequences on the table can also be downloaded (Fig. 19B). To do a different search, either edit the parameters and search again, or click the Reset button.
MegaSearch
PCD also has a more powerful search interface called MegaSearch. MegaSearch allows for additional customization of downloaded results and also allows users to preview the results before downloading. Access the MegaSearch interface via the link in the Search menu. To begin a search, first select the Data Type (Fig. 20A).
.jpg)
Figure 20. The MegaSearch interface.
Once a Data Type is selected, the Query section appears (Fig. 20B) where further filters can be selected. Note the number of data rows that appears right above the Query box. This number can be refreshed to reflect the number of data rows yielded by the search parameters by clicking the "Refresh Count" button (Fig. 20B). This helps the user determine how much data is being returned by the search. Once the search parameters are set, there are options for which data fields are downloaded (Fig. 20C). Users can also view the data prior to download or download a FASTA file (dependent on Data Type).
Trait Descriptors
Users can also search the Trait Descriptors used for phenotypic data stored on PCD. Currently, the only phenotype data is from the USDA-GRIN data that is searchable in BIMS. Access the Trait Descriptor search interface via the Search menu. The Trait Descriptor search has options to filter by group, trait category, and/or keyword (Fig. 21A).
.jpg)
Figure 21. Trait Descriptor Search interface.
The search results are displayed in a table with hyperlinks to more information about the descriptor and trait (Fig. 21B). The results table can also be downloaded (Fig. 21C).
Traits
Users can view the list of traits in PCD two different ways. The list of trait abbreviations can be viewed using the link under the Data menu, and the traits can be searched using the link under the Search menu. The Trait search interface allows users to search by category and/or keyword (Fig. 22A).
.jpg)
Figure 22. Trait Search interface.
The search results are returned in a table format (Fig. 22B) with hyperlinks to more details about the trait. The results can also be downloaded (Fig. 22C).
Tools
To access the different Tools available on PCD, click on the Tools menu in the header and then select the tool you want to use (Fig. 23A). Many of the tools are also quickly accessed through links in the Tools Quick Start (Fig. 23B). To learn more about each search tool, please see the links below the figure.
.jpg)
Figure 23. Tools menu in header and Tools Quick Start on homepage
BLAST
PCD offers BLAST with sequence databases from the crops featured on the database (Fig. 24). Genome, unigene, and reference transcriptome assemblies are available along with model genome sequences from Medicago truncatula, Lotus japonicus, and Glycine max.
.jpg)
Figure 24. Blast Tool homepage.
The Tripal BLAST interface (Fig. 25) looks and functions like the interface available on NCBI and information on the different settings and how to use BLAST can be found in the BLAST Help manual. Please note that one you initiate a job, you are taken to an unique results page that you can book mark and return to later.
.jpg)
Figure 25. Tripal BLAST interface
The BLAST module displays the results in a interactive interface. At the very top are links to download the results in the standard output formats (Fig. 26A). Below is a table with graphical results that can be viewed by clicking the arrows to expand the section (Fig. 26B).
.jpg)
Figure 26. Results from BLAST module.
Users can also view the alignments to the genome scaffolds in JBrowse using the hyperlink to the scaffold (Fig. 27A). To see the BLAST result in JBrowse, click the box in the JBrowse left-side menu (Fig. 27B). Features that are in the PCDdatabase (CDS, peptides, unigenes, RefTrans), will have links to more information in PCD.
.jpg)
Figure 27. BLAST link to JBrowse.
JBrowse
PCD has an instance of the JBrowse genome browser for viewing genome data. A list of the genomes available in PCD can be accessed by clicking the JBrowse link in the Tools menu (Fig. 28). There is a list of genomes with links to open JBrowse under the 'Version' column (Fig. 28A), and links to more information about the genome under 'More Information' (Fig. 28B).
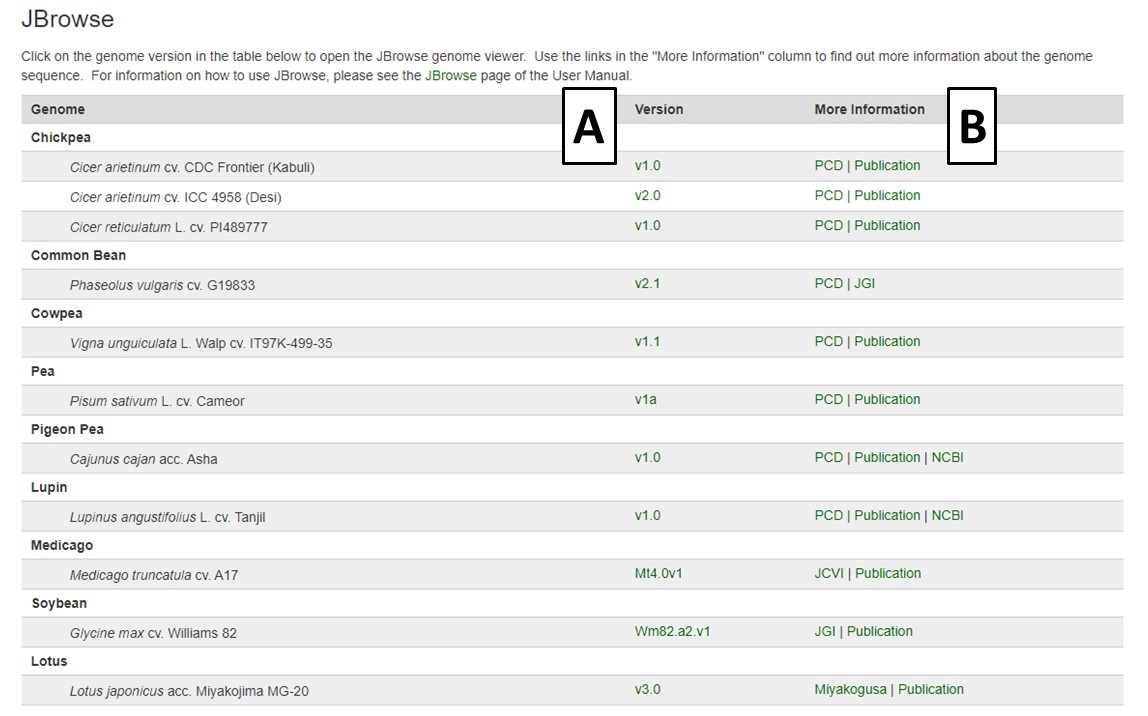
Figure 28. The JBrowse homepage on PCD.
Within the JBrowse window for each genome, there is a left side bar where tracks can be turned on and off (Fig. 29A). There is also a toolbar above the genome region being displayed where the user can zoom in and out, scroll, and select sequences (Fig. 29B). Users can also type a scaffold name and location or a gene or mRNA name in to view that specific feature. Clicking on a gene or mRNA feature also opens a window with more details and a link to information about that feature on the PCD database. Please watch the JBrowse tutorial for more details about how to navigate and use JBrowse.
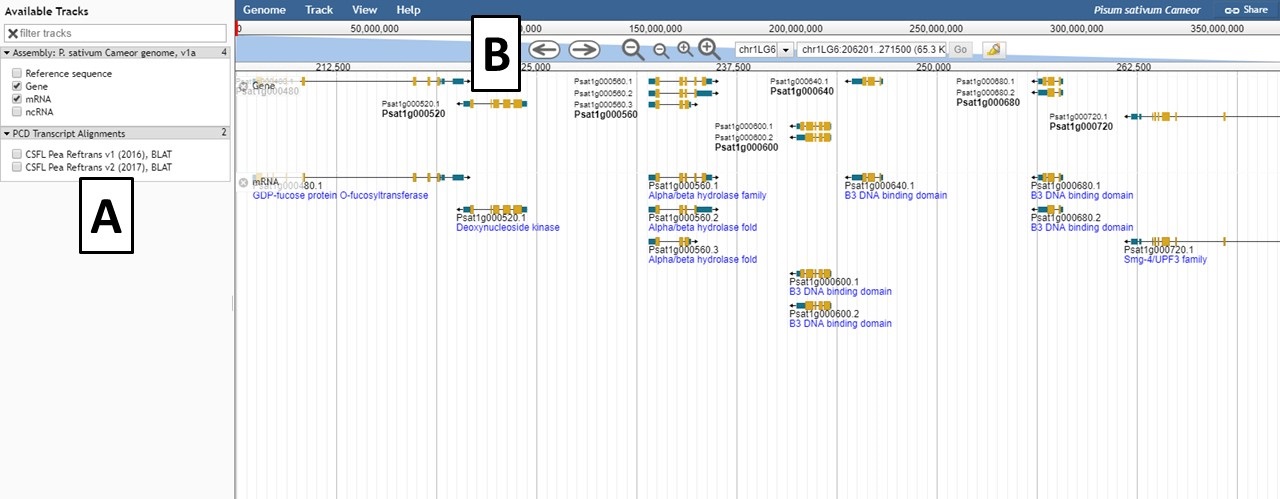
Figure 29. JBrowse interface for a genome.
PathwayCyc
PathwayCyc pathways were generated using Pathway Tools and are available under the PathwayCyc link in the Tools menu. Pathway Tools allows users to view metabolic pathways that are in genomes. Please see the manual for Pathway Tools for more information on use. To access the different genomes, click on the hyperlink in the genome name (Fig. 30).
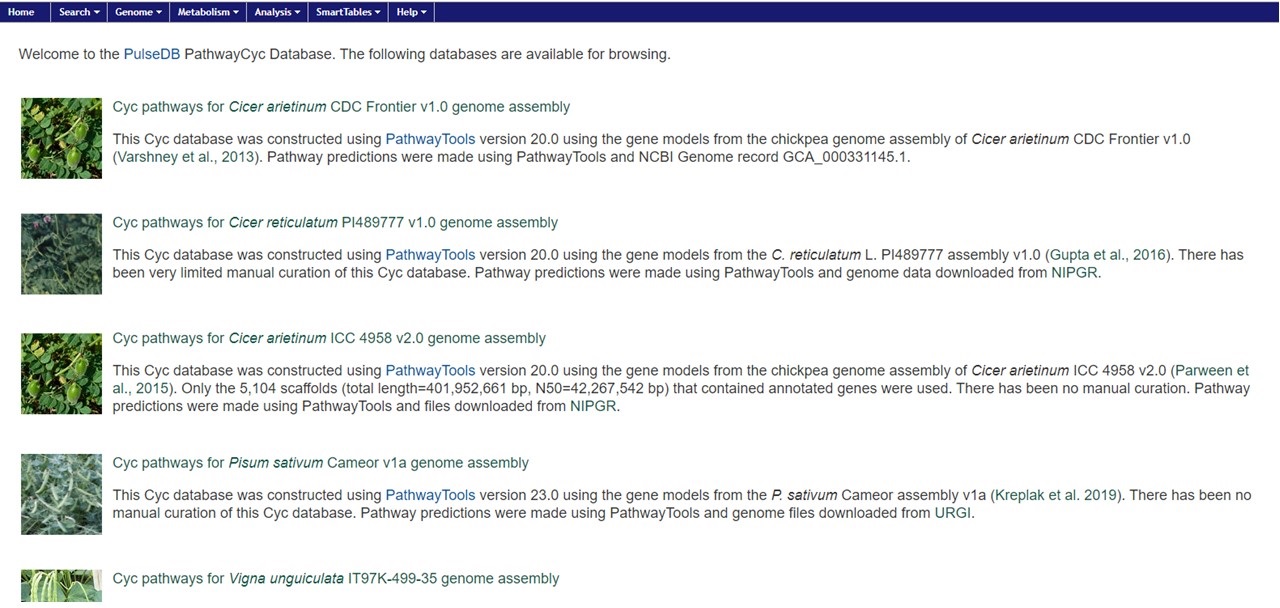
Figure 30. PathwayCyc page with genome list.
Once the genome is selected, the PathwayCyc interface opens and an overview of the genome statitstics is shown. Using the 'Metabolism' menu, the Cellular Overview can be opened as in Fig. 31. Individual pathways can be selected and explored.
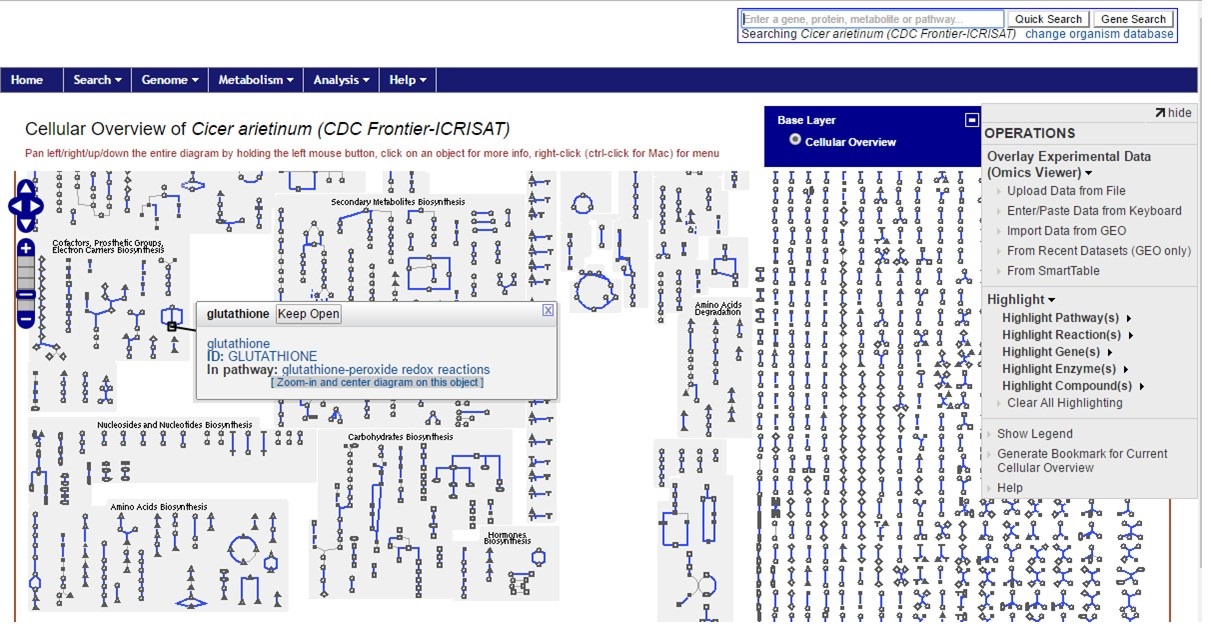
Figure 31. CDC Frontier cellular overview
MapViewer
MapViewer is a new tool for viewing genetic maps on PCD. There are multiple ways to access MapViewer and the first way is from the Tools menu in the header. The link under Tools opens a MapViewer interface (Fig. 32). On this interface, select the species, map, and linkage group to be viewed and click submit (Fig. 32A). The selected linkage group then opens in a new window (Fig. 32C). There are also links to tutorials and examples (Fig. 32B).
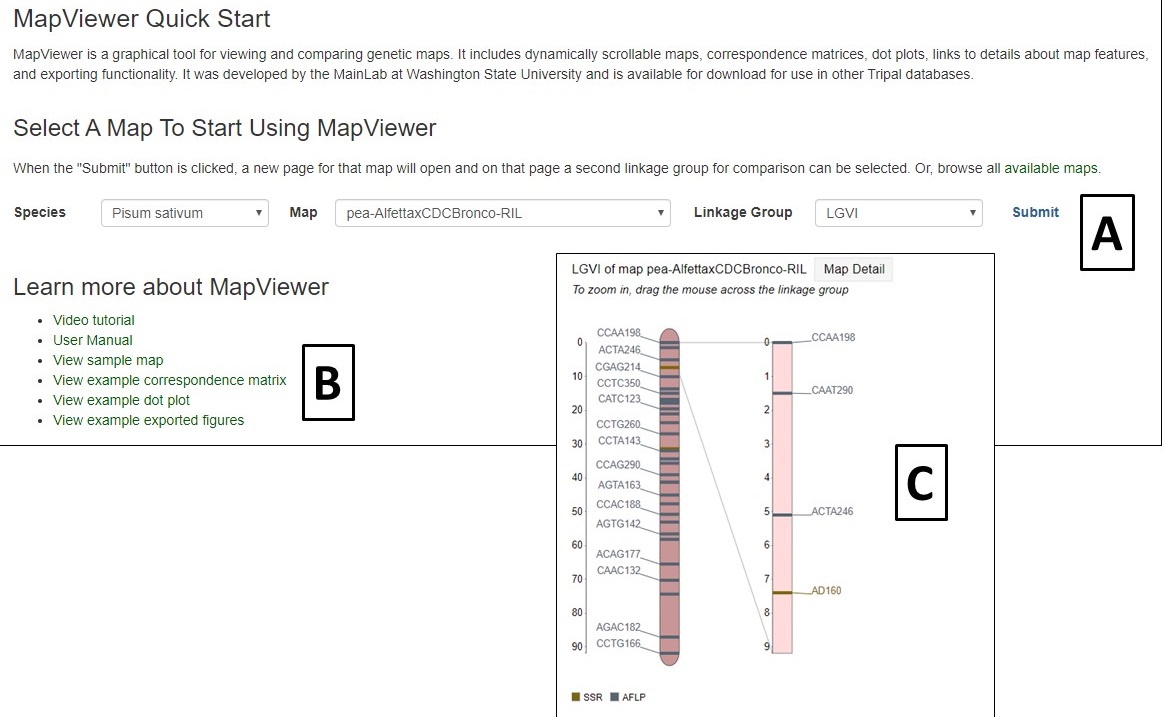
Figure 32. MapViewer interface found under Tools menu.
Another way to access the maps is via the Map Overview page (Fig. 33). The Map Overview page displays a summary graphic of all linkage groups (Fig. 33A) and clicking a linkage group opens a more detailed view in MapViewer. The Map Overview page also has informaiton about the population that the map was generated from (Fig. 33B) and also links to lists of the markers and QTLs on the map (Fig. 33C).
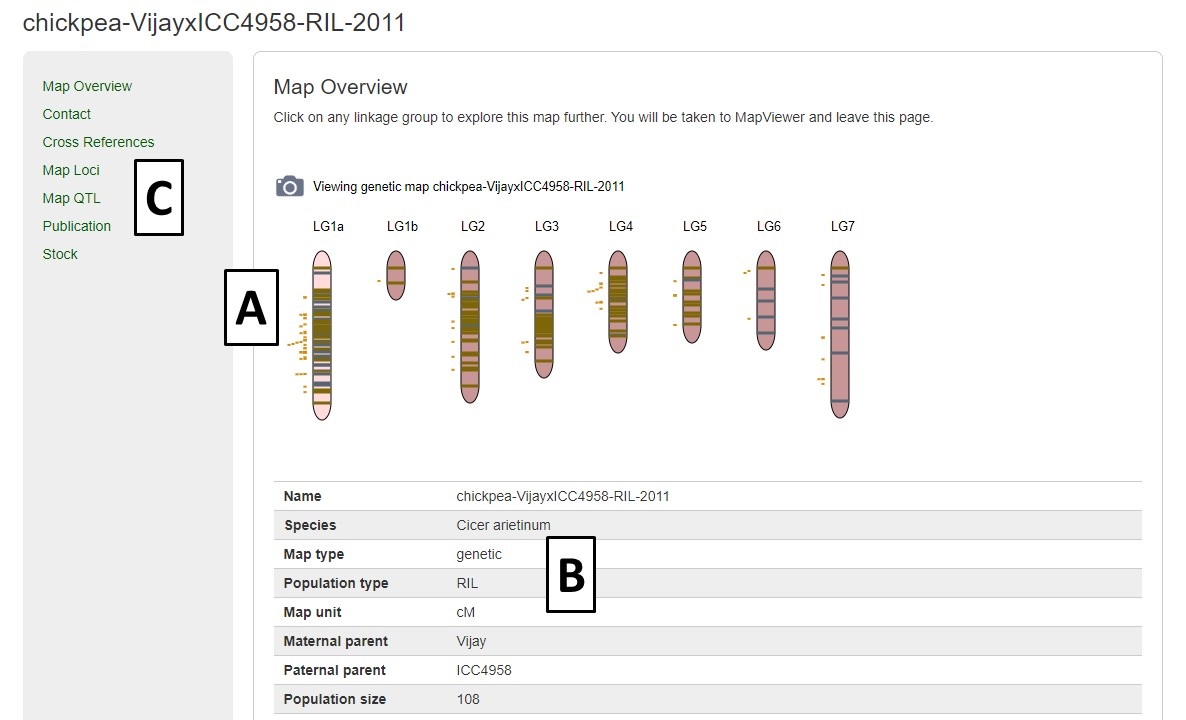
Figure 33. Map Overview page.
MapViewer displays the complete linkage group, and QTLs, on the left, and the selected region on the right (Fig. 24A). The selected region can be changed by dragging and resizing a window on the complete linkage group on the left side. There is a legend of the marker colors below the linkage group figure. Information about the markers is displayed when the pointer is over a marker name on the right side graph (Fig. 34B). Clicking on the marker name, opens the marker details page.
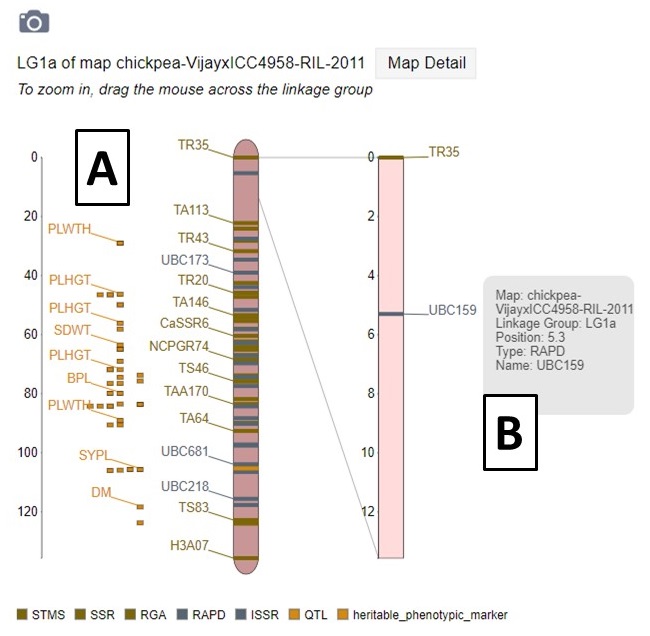
Figure 34. MapViewer displays a static linkage group graph on the left and a dynamic graph on the right.
A different map or linkage group can be displayed using the controls at the bottom of the MapViewer page (Fig. 35A). A comparison map can also be turned on by clicking on the "Show comparison map" box (Fig. 35B). The color of the markers and which markers are displayed can be changed with the controls and the ruler and marker positions can also be toggled on or off (Fig. 35C). After changing any of the four parameter sections, the Submit button must be pressed to display the changes. There are also places to click to view the Dot Plot and Correspondence Matrix for the compared maps.
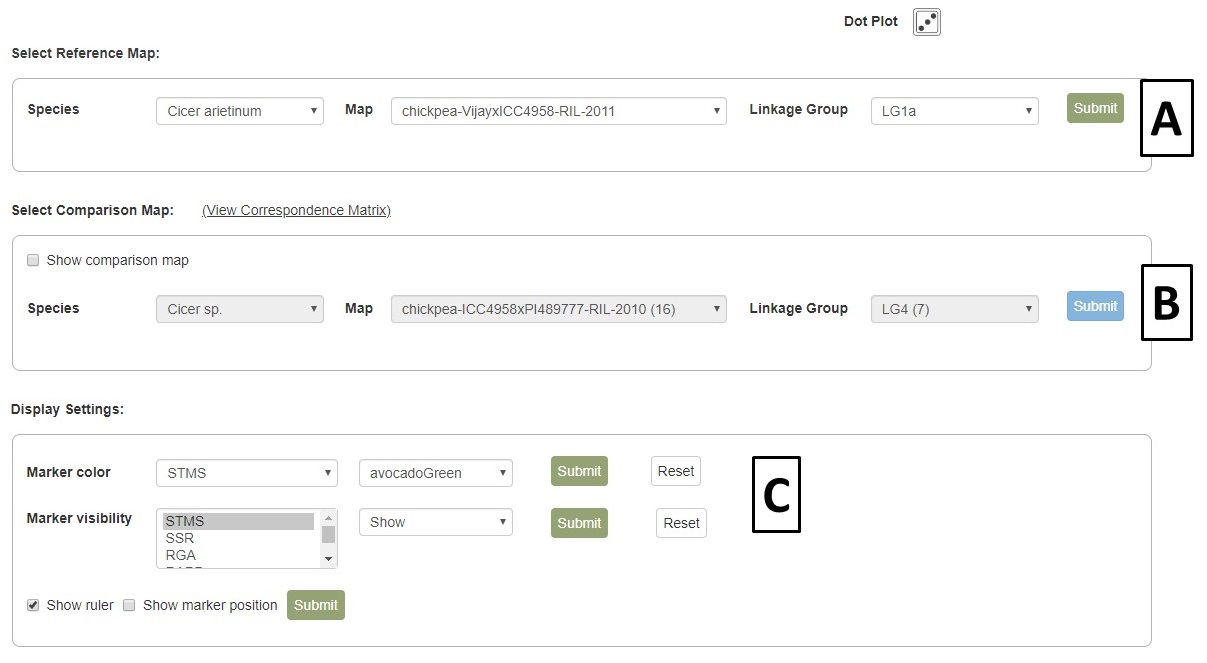
Figure 35. MapViewer control panel.
When comparison maps are displayed (Fig. 36), the common loci are connected with a line and the zoomed in area for each map can be adjusted independently. See the next section of the manual to learn about exporting figures from MapViewer.
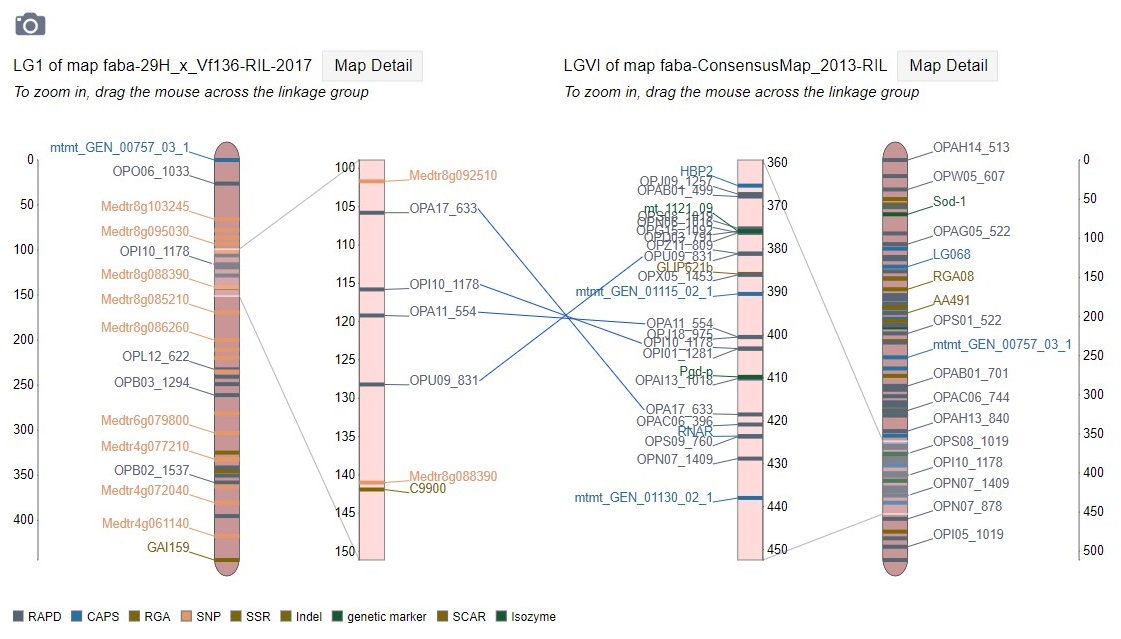
Figure 36. Comparison map view.
Pictures from MapViewer
MapViewer allows users to export figures as a high-resolution PNG file that is suitable for publication. Items that can exported have a clickable camera icon that will trigger a file download. Users can export the map overview which has all the linkage groups (Fig. 37), a single linkage group (Fig. 38), a linkage group comparison (Fig. 39), a dot plot (Fig. 40) or a correspondence matrix (Fig. 41).
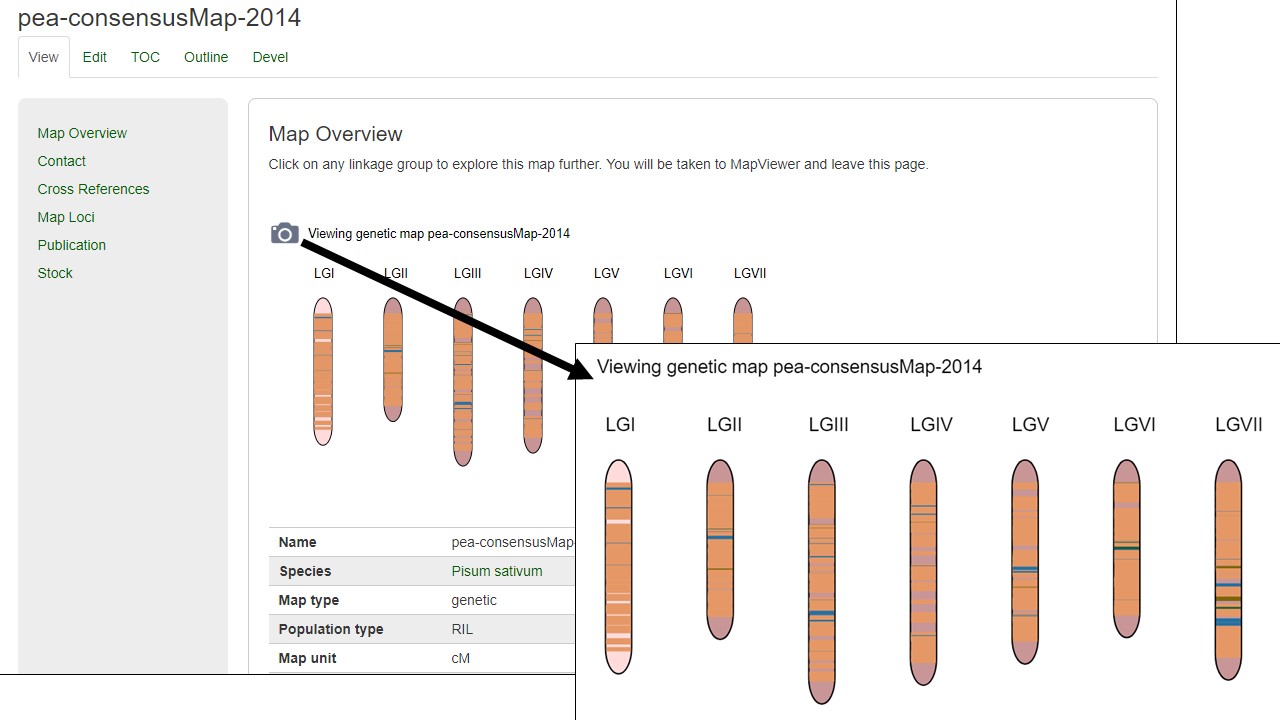
Figure 37. How to download a map overview.
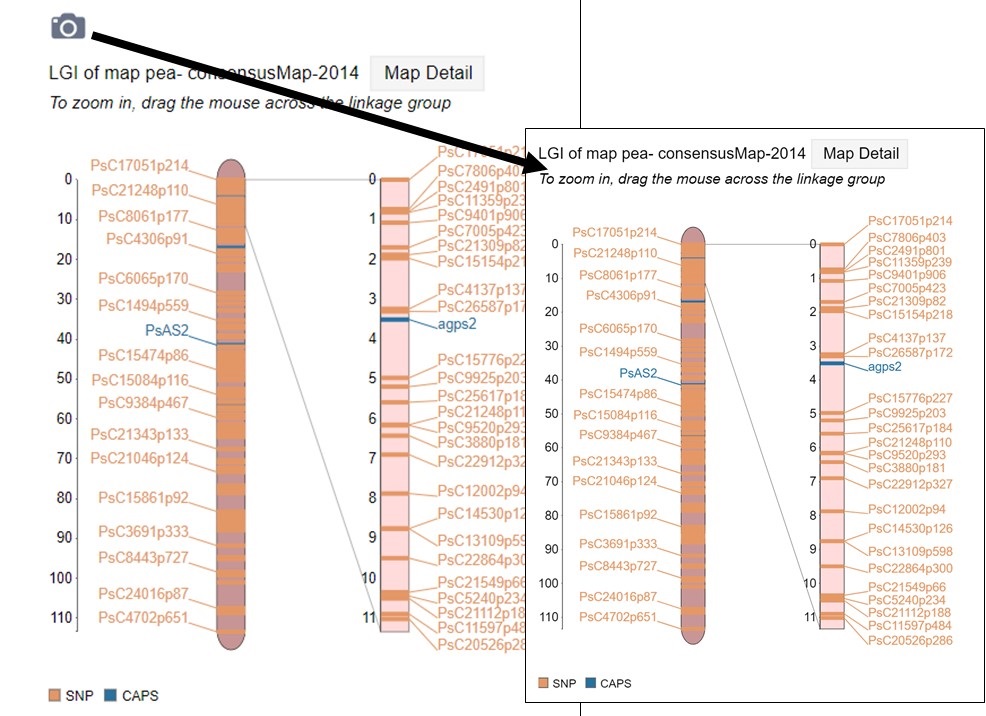
Figure 38. How to download a linkage group figure.
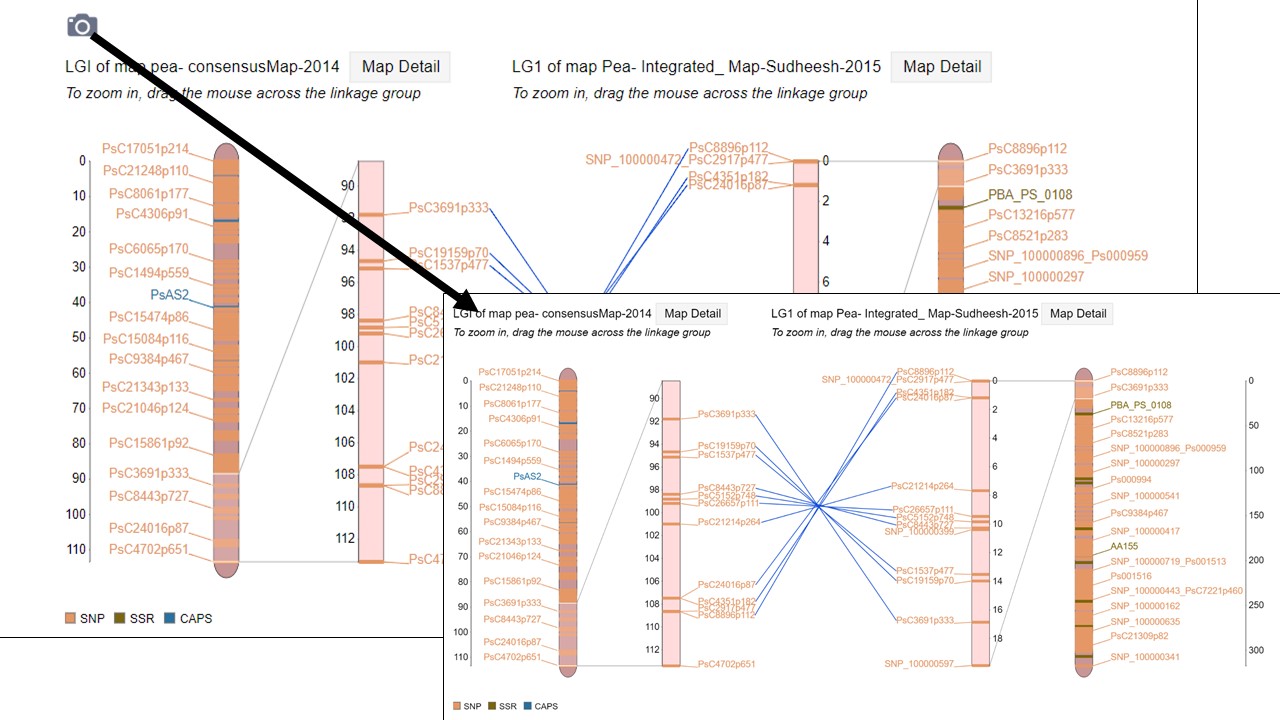
Figure 39. How to download a linkage group comparison figure.

Figure 40. How to download a linkage group comparison dot plot.
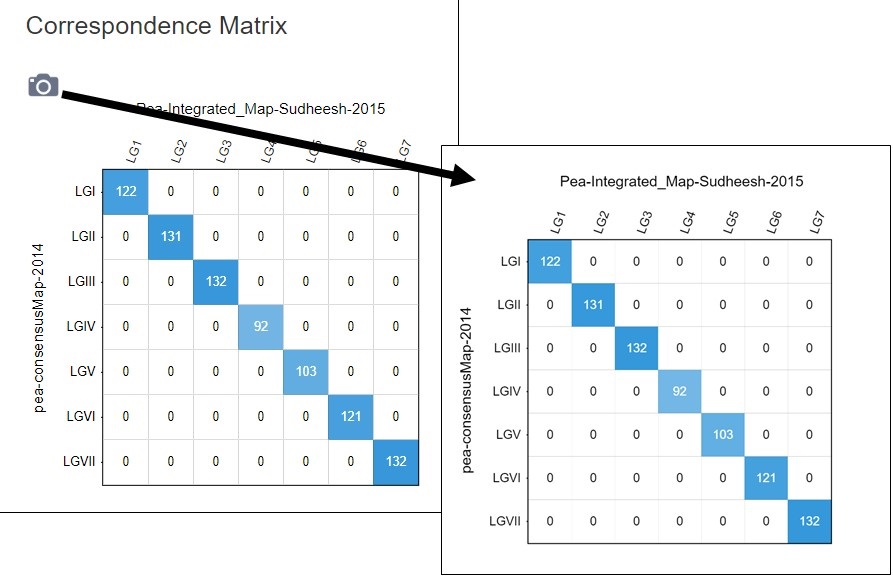
Figure 41. How to download a linkage group comparison correspondence matrix.
Synteny Viewer
PCD uses the Tripal Synteny Viewer, developed by the Fei Bioinformatics Lab, to display the analysis results of genomes that were compared using the program MCScanX. Synteny Viewer is accessed under the "Tools" menu. To get started with Synteny Viewer, first select a genome (Fig. 42A). The "Chromosome/Scaffold" menu will then populate with the names of the appropriate scaffolds or chromosomes and one of these sequences can be selected (Fig. 42B). The final option is to select one or more genomes for comparison (Fig. 42C), and then the "Search button" is clicked to start the search. Alternatively, if the block ID number is already known, the block ID value can be input directly to return just those results.
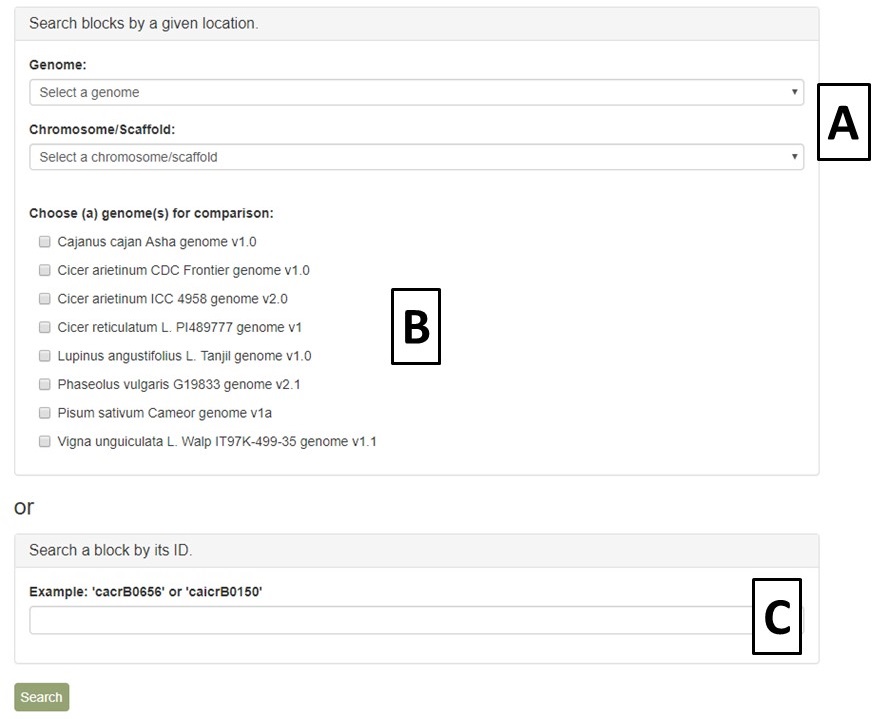
Figure 42. Options for Synteny Viewer search.
When the search is complete, a new page opens with the results. There is a summary of the input settings at the top of the page. When multiple genomes are queried, there are tabs to switch between the results and the circular graph will change when a different genome is selected. The syntenic regions are indicated on the circular graph by gray lines. When the mouse hovers over the gray line, a summary is displayed (Fig. 43). Clicking on the gray lines, opens a page with more details (see below, Fig. 45).
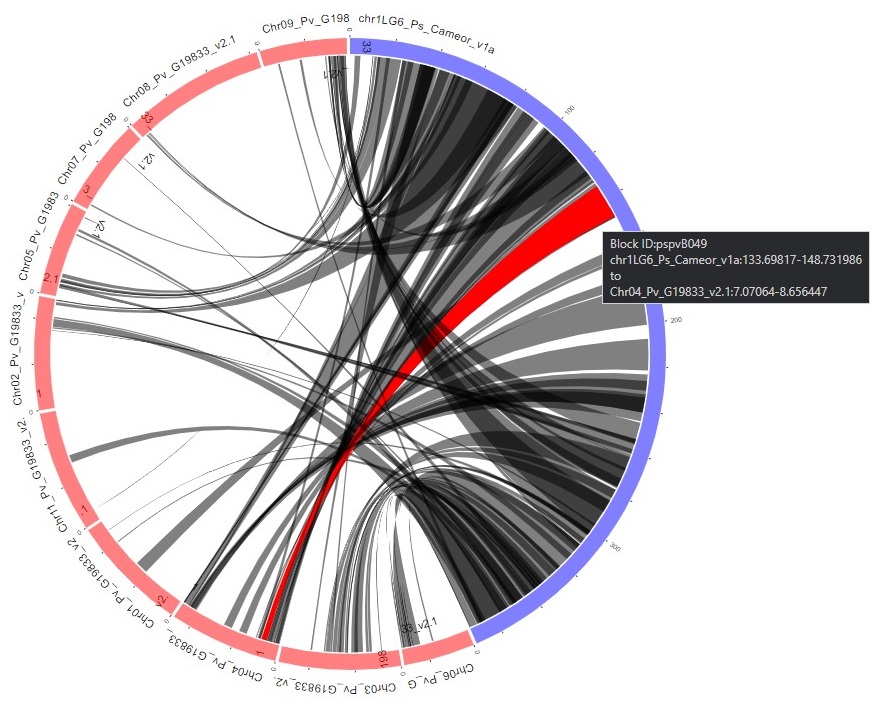
Figure 43. Synteny results in circular graph.
Under the circular graph is a table listing the syntenic blocks (Fig. 44) that are displayed as gray lines in the circular graph. Clicking on the block name opens the same details page as clicking on the gray lines on the circular graph.
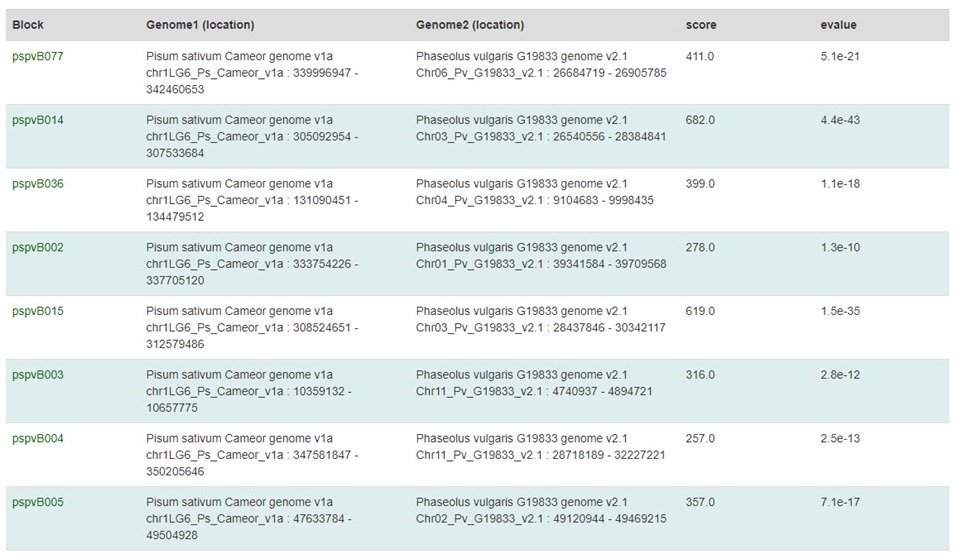
Figure 44. Synteny block table.
The syntenic block details page has an overview section at the top listing the details for each genome in the comparison, a side-by-side graphic of the syntenic block from each genome, and a table showing the genes in the syntenic block from each genome (Fig. 45). The side-by-side graph can be zoomed-in by using the scroll wheel on the mouse and the view can be shifted up or down by click and dragging. Clicking on the gene name in either the table or on the graphic will open the feature details page from the PCD database.
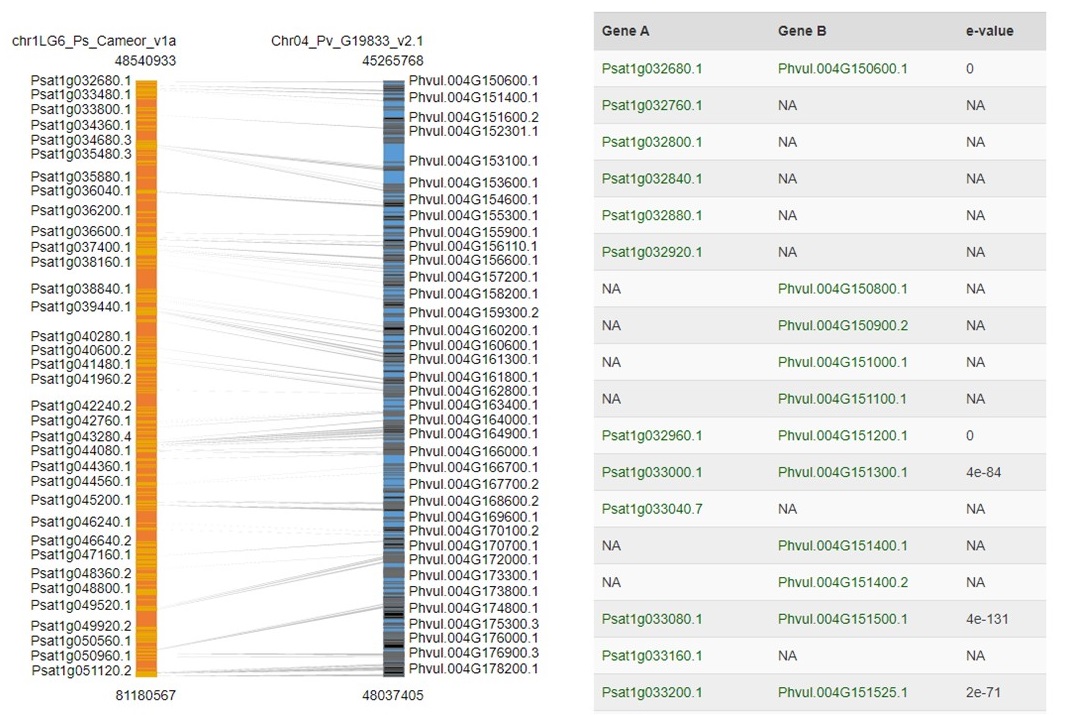
Figure 45. Syntenic Block details page.
PCD Video Tutorials
Please check out the tutorial videos for our databases on the MainLab YouTube channel. The searches and tools use the same framework across all of our databases.
-
Searches
-
Tools
-
Advanced queries and data retrieval
- How to download markers from map region
- How to view genomes linked to genetic maps
- How to go from BLAST to mRNA to JBrowse
- How to go from trait to GWAS to gene to ortholog
- How to find a marker associated with a trait
- How to download protein sequences
- How to view correspondences between genomes and genetic maps
Or you can watch the entire playlist below.
BIMS (Breeding Information Management System)
PCD BIMS (Breeding Information Management System) is a Tripal module being developed by Mainlab Bioinformatics which allows users to explore the publically available breeding data in PCD while also providing a data management solution for private breeding programs. BIMS is now open for breeders to create an account and start using it with current functionality. It is being continuously developed and once complete it will provide individual breeders with a secure and comprehensive online breeding management system that allows them to store, manage and analyze their private data, fully integrated with publicly available genomic, genetic and breeding data within Tripal databases such as PCD.
The BIMS tool now supports the use of Field Book, an Android app developed by the Poland Lab at Kansas State University for collecting phenotype data in the field. Field Book is a free app that is available through the Google Play Store. It provides easy and customizable interfaces for entering all types of biological data.
BIMS can be accessed via the "Tools" menu and then selecting "BIMS". The BIMS interface will then open. Public data is available for all users of PCD without requiring an account. Users can download public data from BIMS without an account, but will need a PCD user account to save search results within the website. Access to private breeding data also requires users to log in with their PCD user account. To create a breeding program, users must first create a PCD account and contact using the contact form for breeder privilege.
The complete BIMS User Guide is found at: https://www.breedwithbims.org/manual